1 What is FOCUST?
The Fluorescent Object and Cell gpU-accelerated Segmentation Toolbox is a 3D image analysis plugin for FIJI/ImageJ.
The goal: To provide an easy-to-use solution for segmenting and relating 3D datasets acquired by fluorescence microscopy in ways that reflect the biological sample. FOCUST provides an interactive optimization mode to configure segmentation parameters and numerous analysis modes to relate and manage data in a biologically meaningful way.
You can download a PDF version of the documentation here:
1.1 Things that were important:
Speed: FOCUST is GPU-accelerated thanks to CLIJ2.
Ease of use: FOCUST is designed to be user-friendly and intuitive.
Batch processing: Process an entire folder of images without coding.
Data outputs: All images saved. All .csv files appended by column.
Advanced workflows: Without having to write and debug scripts.
2 Citation
FOCUST is based on a publication. If you use it successfully in your research please kindly cite our work:
S. E. Amos, L. P. Black, N. J. Pritchard, Y. S. Choi, FOCUST: Fluorescent Object and Cell gpU-Accelerated Segmentation Toolbox. Small Methods 2025, e00154. https://doi.org/10.1002/smtd.202500154
3 Acknowledgements
FOCUST uses some excellent open-source dependencies and we’d like to acknowledge and thank those developers.
4 Gallery
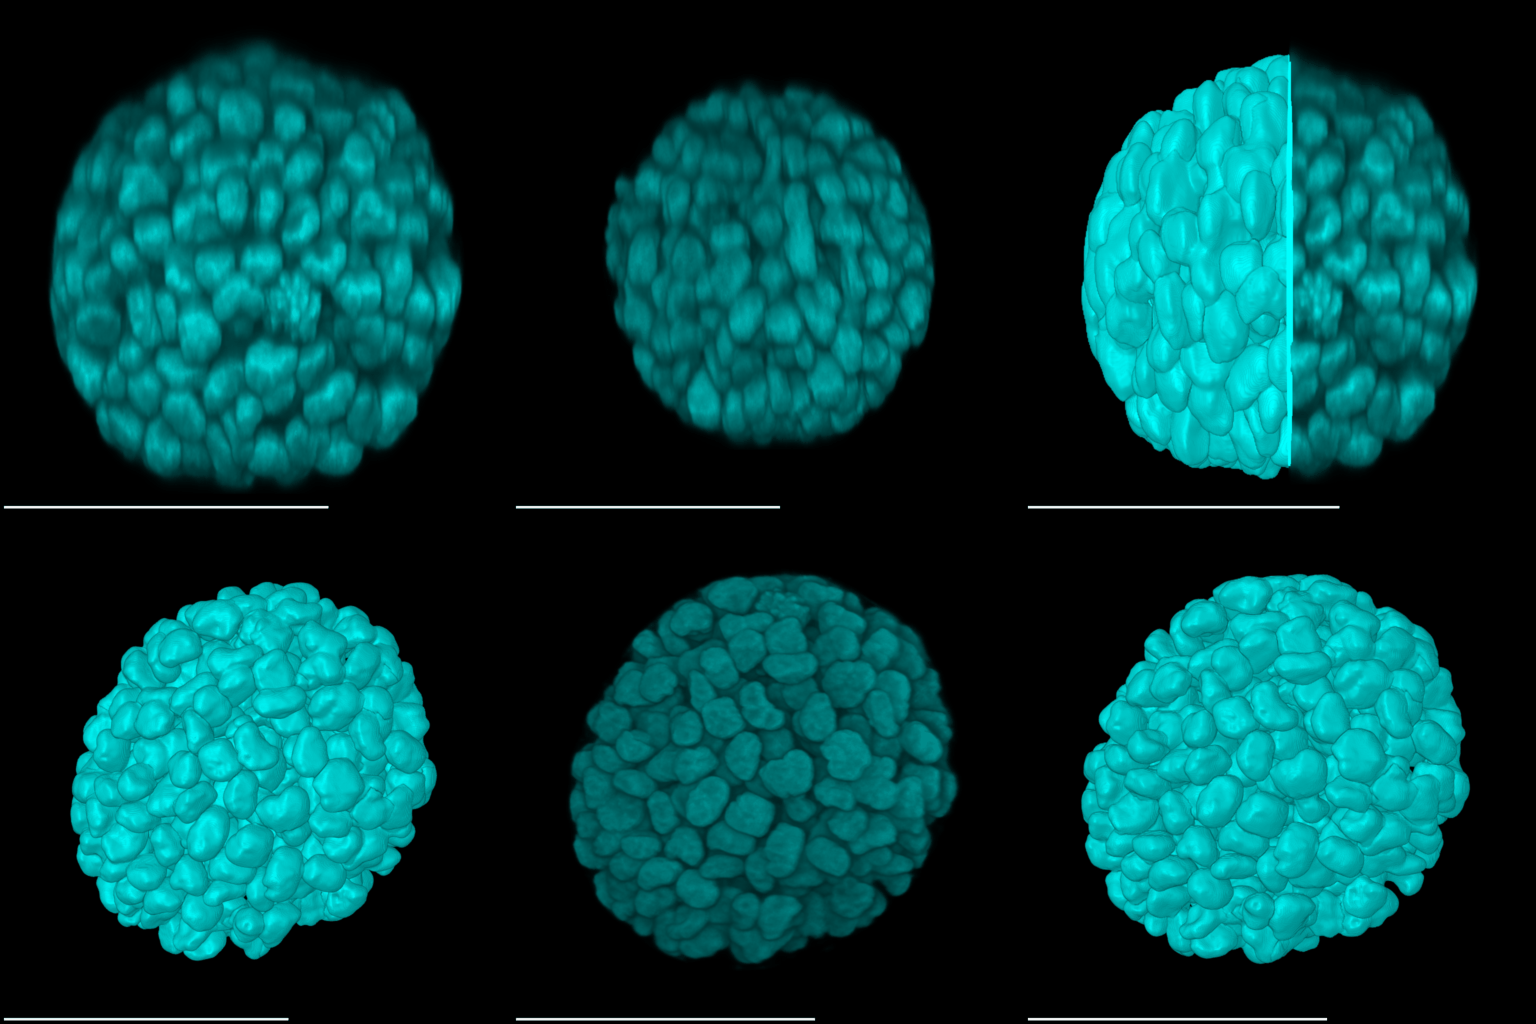
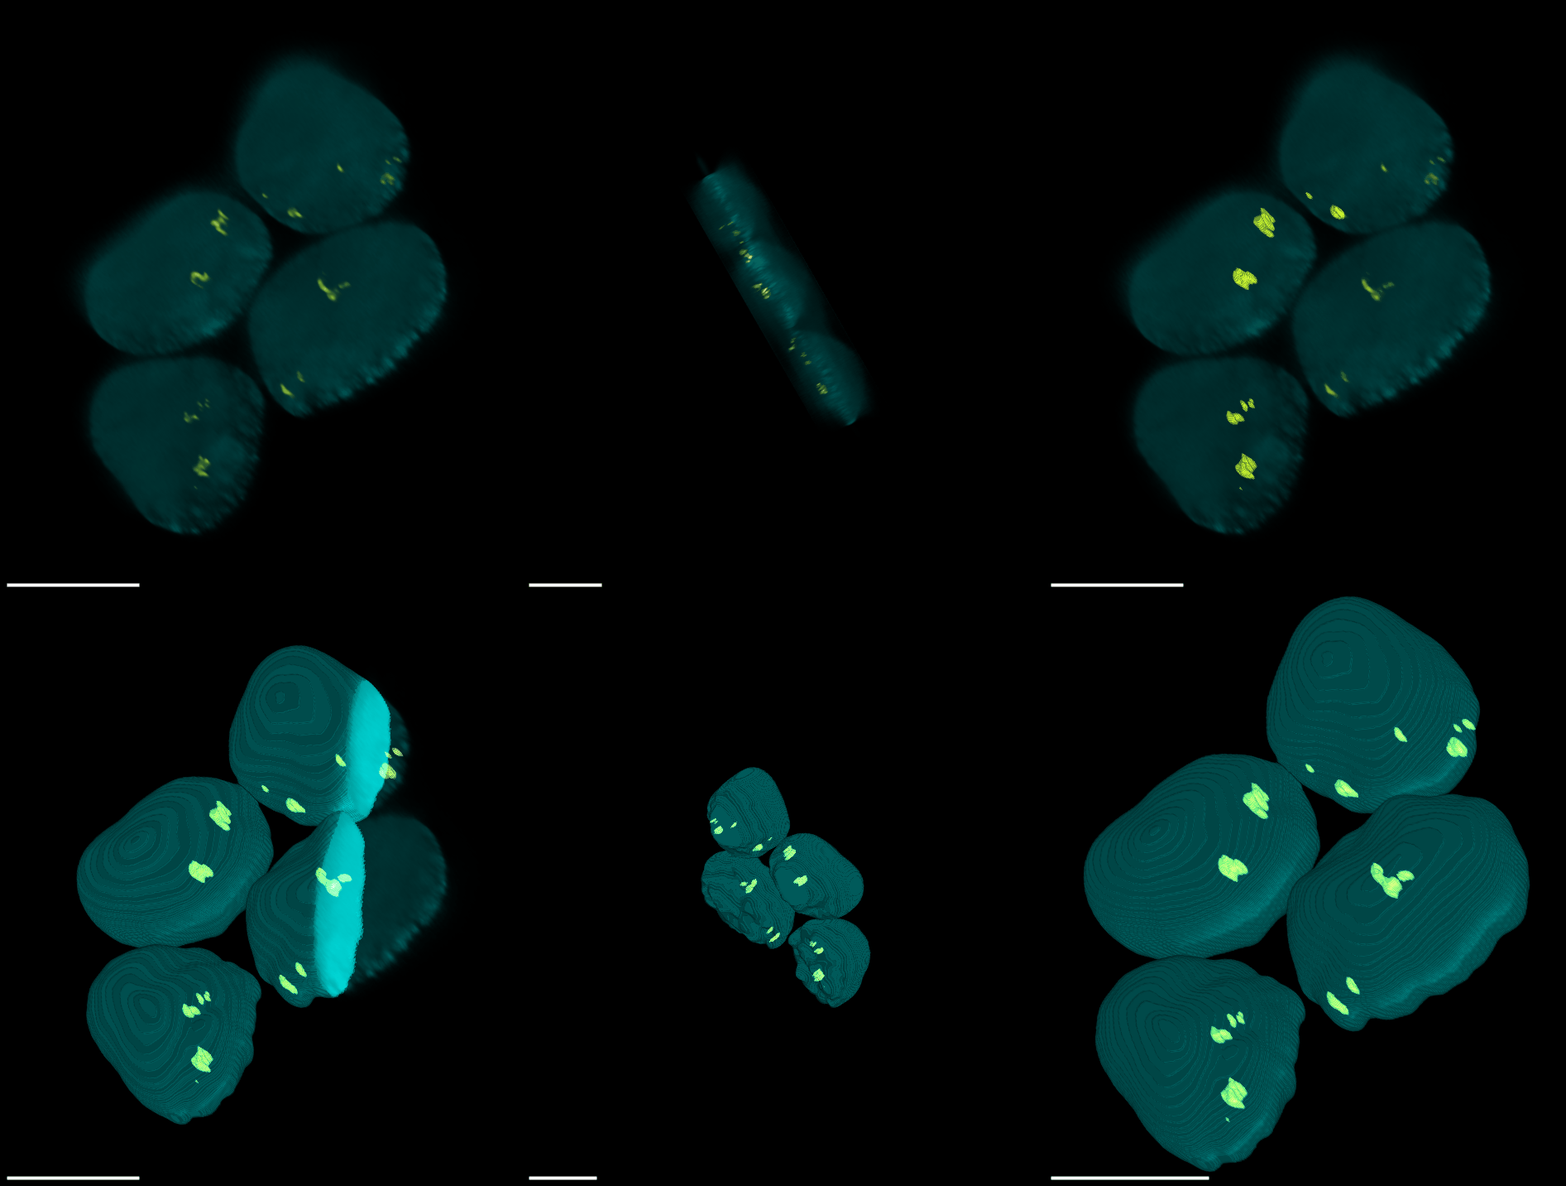
| Spheroid (100 µm) | Single Cell (100 µm) | Speckles (10 µm) |
 |
 |
 |
5 Documentation
5.1 Videos
5.2 Installation
- Download and install FIJI: https://imagej.net/software/fiji/downloads
- In the toolbar: Help > Update
- Click manage Update Sites
- Tick the following options:
- FOCUST
- CLIJ
- CLIJ2
- CLIJx-assistant
- CLIJx-assistant-extensions
- IJPB-plugins
- Apply changes and restart FIJI when prompted
For FAQs regarding the compatibility of CLIJ, please visit the project page.
5.3 FOCUST Object Types
FOCUST manages segmented image data as object types (primary, secondary and tertiary) which are used to represent a biological context in different analysis modes. For example, consider we have an image stack with 3 channels. Channel 1 contains a stain to visualize the nucleus (DAPI), channel 2 contains a protein of interest that we would like to measure, and channel 3 contains a stain to visualize the whole cell (Phalloidin). We can segment channel 1 into nuclei and channel 3 into cells, but we have no easy way of relating each cell to it’s nucleus. FOCUST analysis modes provide a way to relate 3D objects to each other in ways that reflect the sample type. Primary objects are always nuclei, while secondary and tertiary object contexts are mode-dependent. Details in Section 5.7.
5.5 Optimize
Many classical bioimage segmentation tasks abide by a generalized pipeline of pre-processing, thresholding and separation. Testing different filters, thresholds and methods to find something that works for the majority of a data set can be very time consuming. FOCUST’s optimization mode allows a user to select a directory that contains images representative of a larger data set, configure segmentation parameters for the desired object types, and process on demand to see what configuration works for that data set. Segmentation outputs can be combined as labels or outlines to improve segmentation quality assessment or to easily generate combined representative figures.
5.5.1 Optimize User Interface
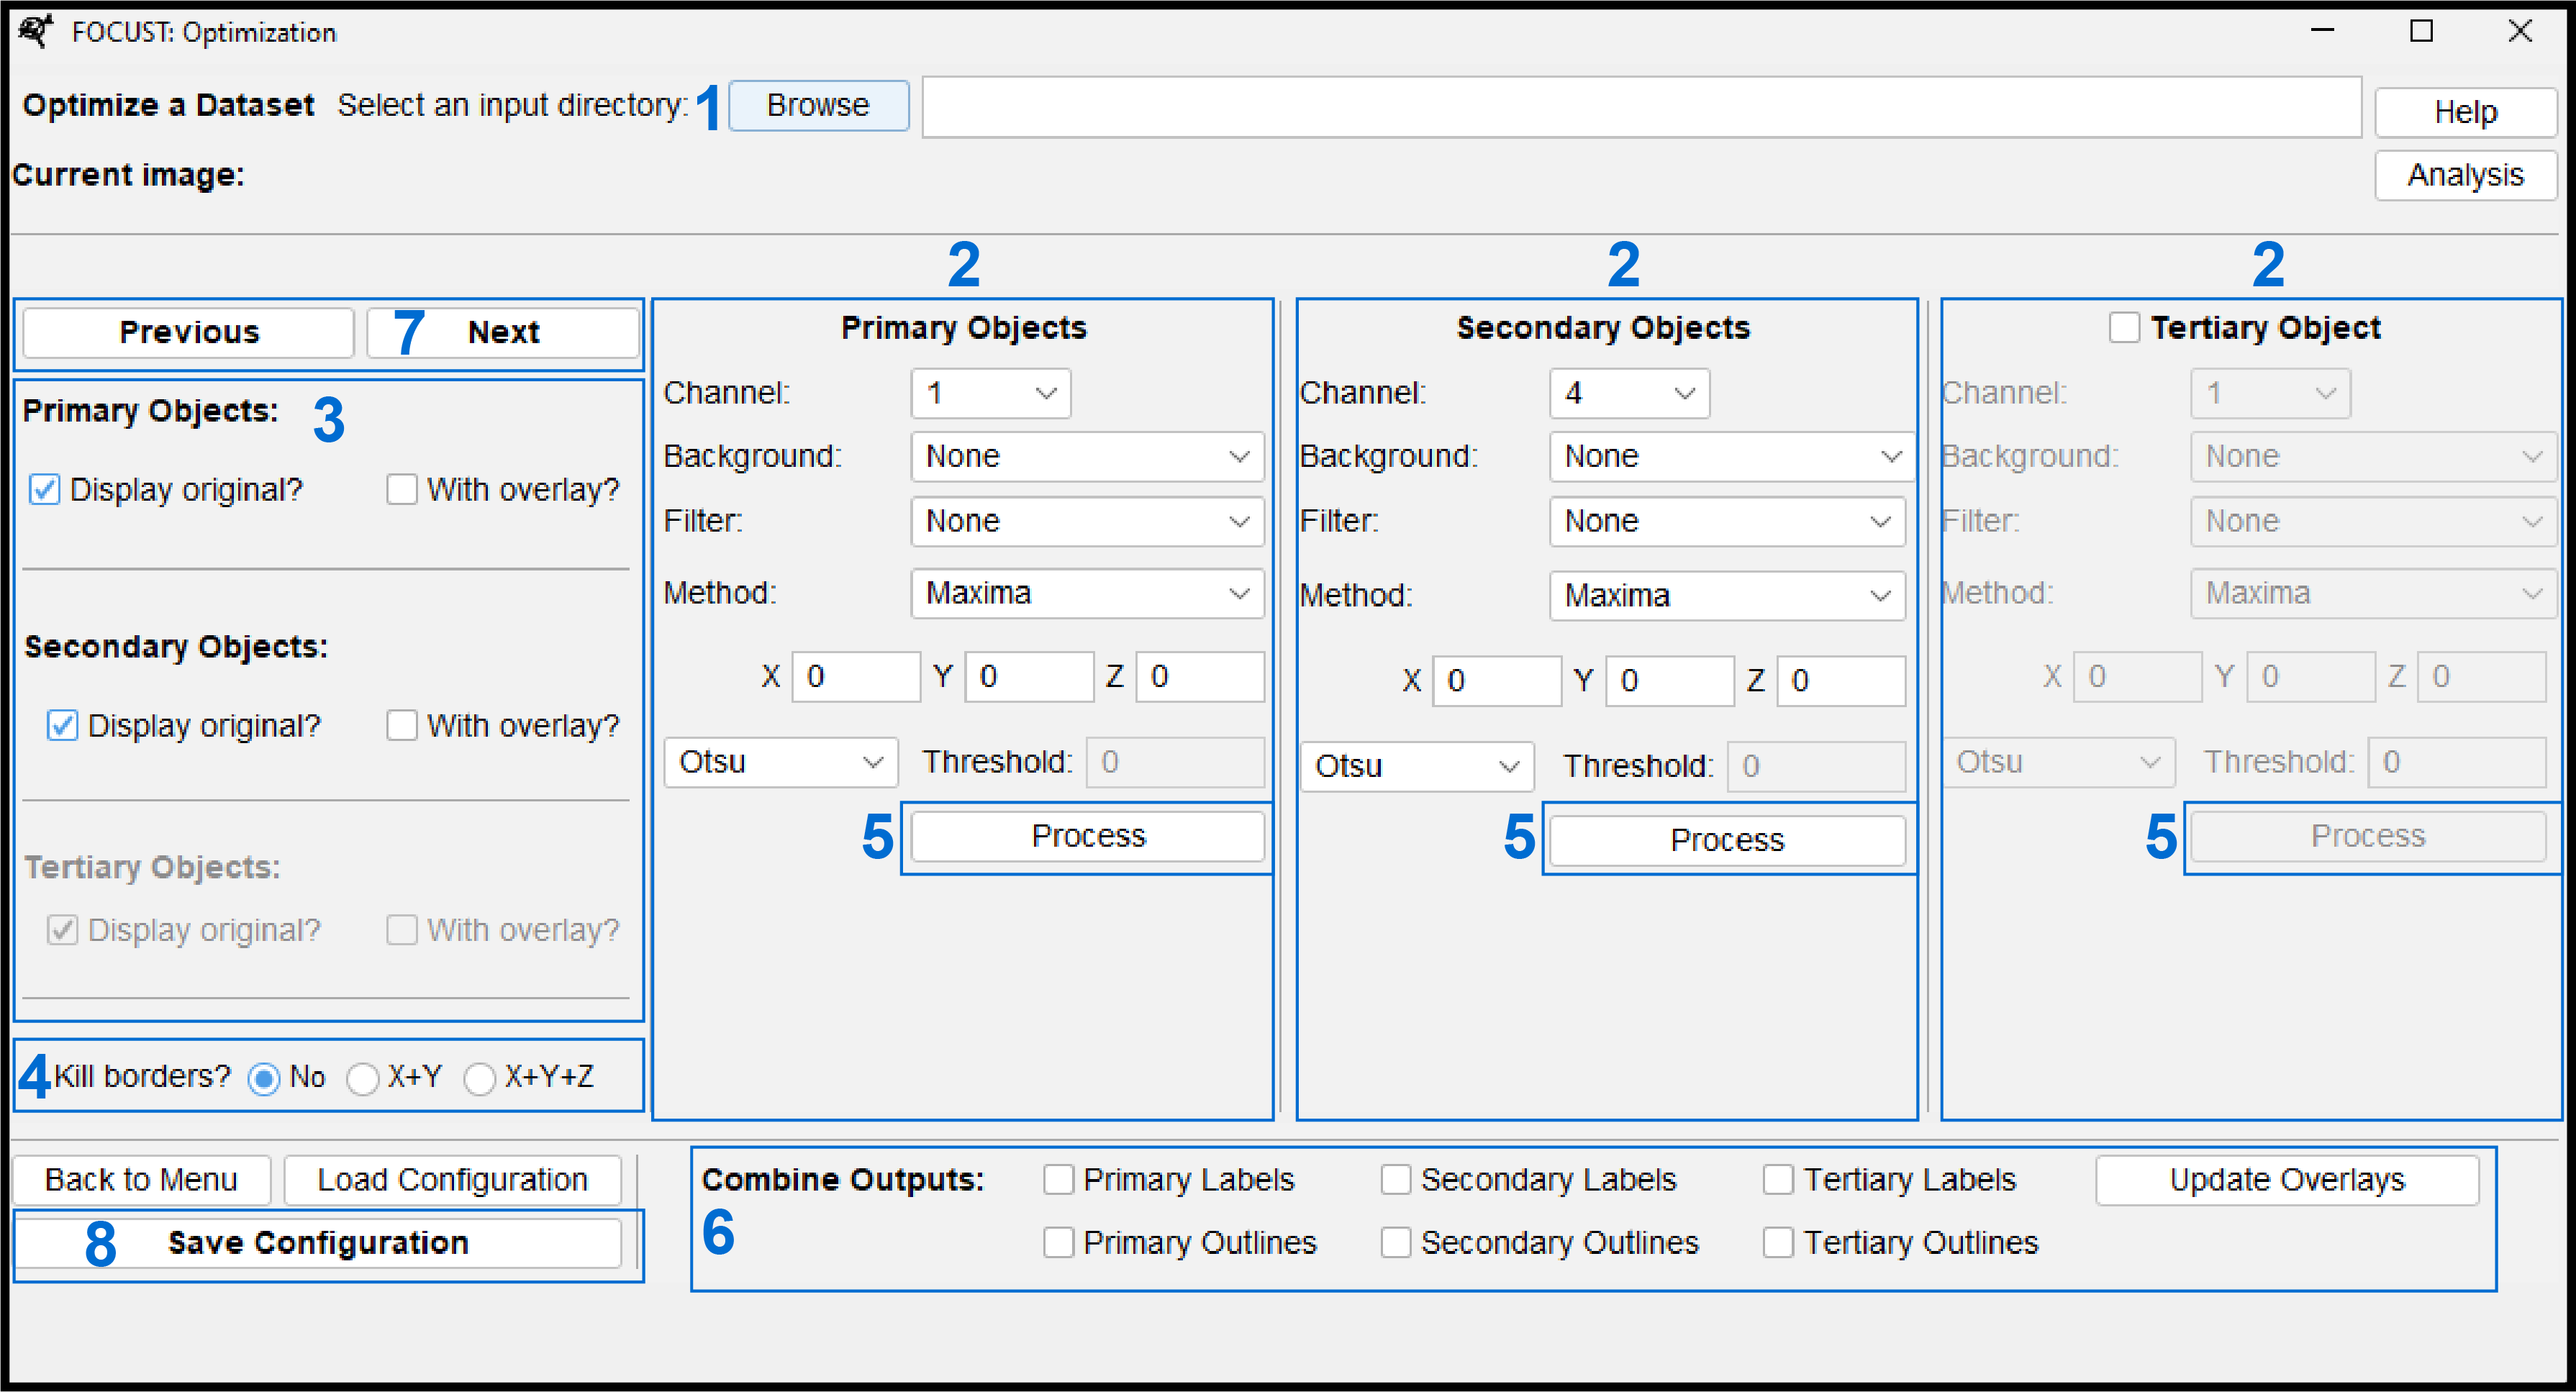
Select a directory that contains some sample images that are representative of a data.
Configure segmentation parameters for an object type. Function details in Section 5.10.
Select a channel
Background filters are especially good at removing non-specific noise. Provide an x, y, z value i.e. (2 or 2.0).
Foreground filters are used to smooth and homogenize the shapes you wish to threshold and eventually segment. It is generally recommended that you use one. Provide an x, y, z value (i.e. 2 or 2.0).
Select a method to label and/or segment objects.
Select a threshold. Only manual thresholds require a value to be entered.
Configure display options. You can display the original image alongside the segmented output with out without outlines of the segmented output. With outline overlays may help assess the accuracy of segmentation.
Select a Kill borders option. If any of the final segmented labels might touch an X, Y or Z image border it is best to activate the appropriate kill borders function. Measuring incomplete labels can skew a data set.
Click process to run the configured segmentation. The output and any selected display options will display and auto-arrange themselves on your screen. You should only try to process one object type at a time.
- You can now assess the accuracy of your segmentation. Tweak and reprocess your segmentation as required.
Once you have more than one object type displayed (i.e. primary and secondary objects) you can combine these outputs to aid in segmentation assessment or representative figure construction. For example, you might choose to combine the outline of a primary object (nucleus) and the solid label of a secondary object (sub-nuclear speckle).
Click “Next” or “Previous” to move through the specified and open another image. Once the “Current Image” label has updated, you can apply or tweak your segmentation parameters for that image.
If you would like to save a copy of your segmentation configuration to use for analysis or your reference for a future optimization session, you can click “Save Configuration” to save a FOCUST-optimization-file (see Section 5.7.2).
5.5.2 Troubleshooting
Labels are over segmented: Try increasing the size of a background or filter operation. Some filters (such as the difference of Gaussian) can accentuate signal voids as they are primarily there to reduce background noise. If you are using one such filter to clean the background, consider applying another filter to smooth the image before thresholding.
Background noise is being segmented as an object: Consider adding a background filter like a difference of Gaussian or increasing the size of the operation if you already have one. If an automatic threshold is detecting a large amount of non-specific noise, you can try using a greater or smaller constant (in the menu as G. Const. or S. Const.). These threshold let you manually set a threshold cut off to only keep values that are either greater than or less than a constant. As long as the things you wish to segment are of a higher or lower enough intensity difference these thresholds can be very effective.
5.6 Label Processing
Additional label processing may provide meaningful insights into 3D spatial patterns of expression, object distribution or object morphology. When running analysis, you can choose to skeletonize and/or stratify your segmented objects. The outputs of these methods will be managed by FOCUST depending on the selected analysis mode.
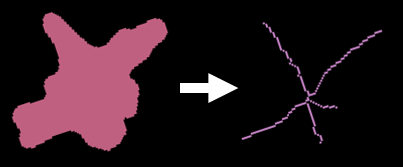
5.6.1 Skeletonization
We have implemented the widely used Skeletonize3D and AnalyzeSkeleton plugins to thin 3D labels, providing length and branching data. Skeletons are matched back to the labels they were derived from where appropriate. This was required following observations of label mismatching when the skeletons are re-labelled.

5.6.2 Stratification
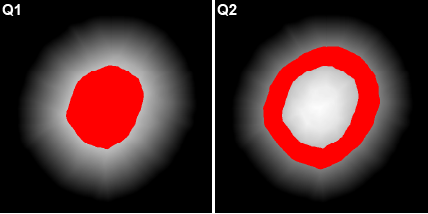
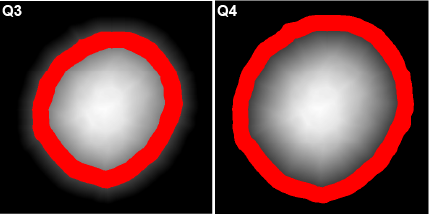
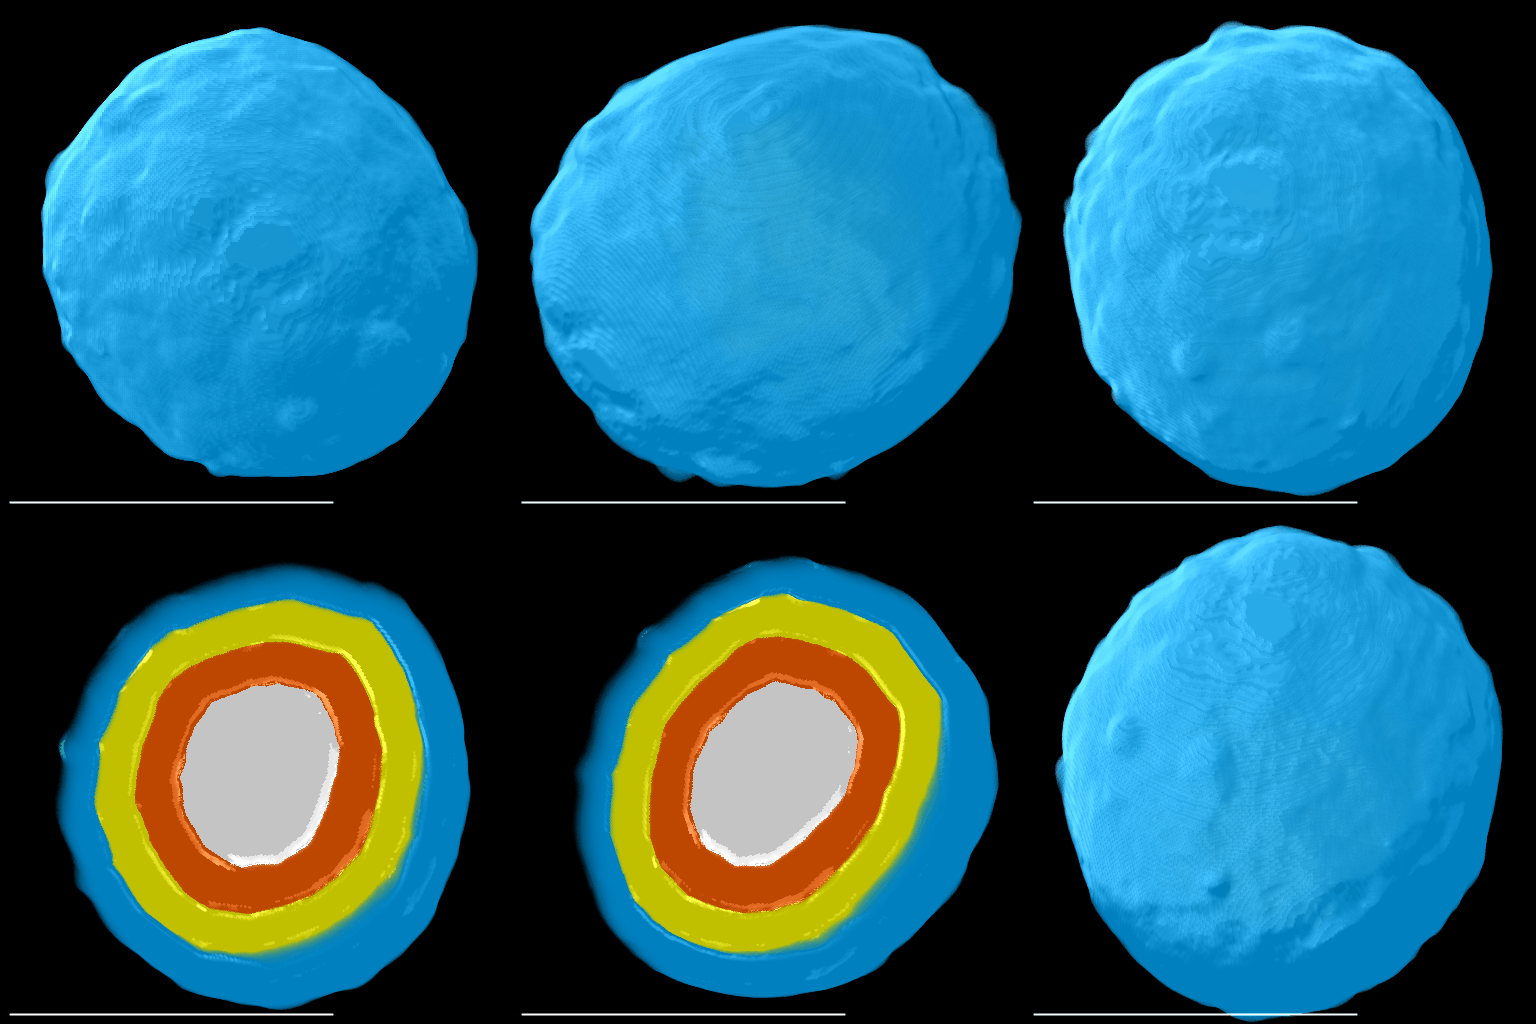
The spatial distribution of smaller object types or stains within larger object types may be useful. Users have the option of stratifying any object type into 25 % and/or 50 % bands based on a 3D distance map. When selected, the intensities of all available channels in the original image will be quantified within each band. The stratified bands will also be used for additional analysis depending on the selected mode (see Section 5.7).
Generated bands are saved and referenced in the output csv files with the following naming convention:
| 25 % Bands | 50 % Bands |
Prefix: “Q” for quarter. Q1:Q4 where Q1 = core and Q4 = periphery. |
Prefix: “H” for half. H1:H2 where H1 = core and H2 = periphery. |
Here, a spheroid has been stratified into 25 % bands to interrogate the spatial distribution of proteins of interest and nuclei within the spheroid.
 |
 |
 |
 |
Running this method on objects that touch the image’s borders will generate inappropriate 3D distance maps. If you have objects that touch your image borders, consider selecting one of the kill borders options. This method may also yield unexpected results if an object’s surface geometry is highly convoluted or anisotropic.
5.7 Analyze
FOCUST will generate morphological results for all segmented object types and quantify the intensity of all available channels within each object (including stratified bands if selected). FOCUST generates and saves four different files types: Segmented images (.tif), results (.csv), a FOCUST-parameter-file (.json) and a log file.
5.7.1 Analyze User Interface
5.7.1.1 Basics
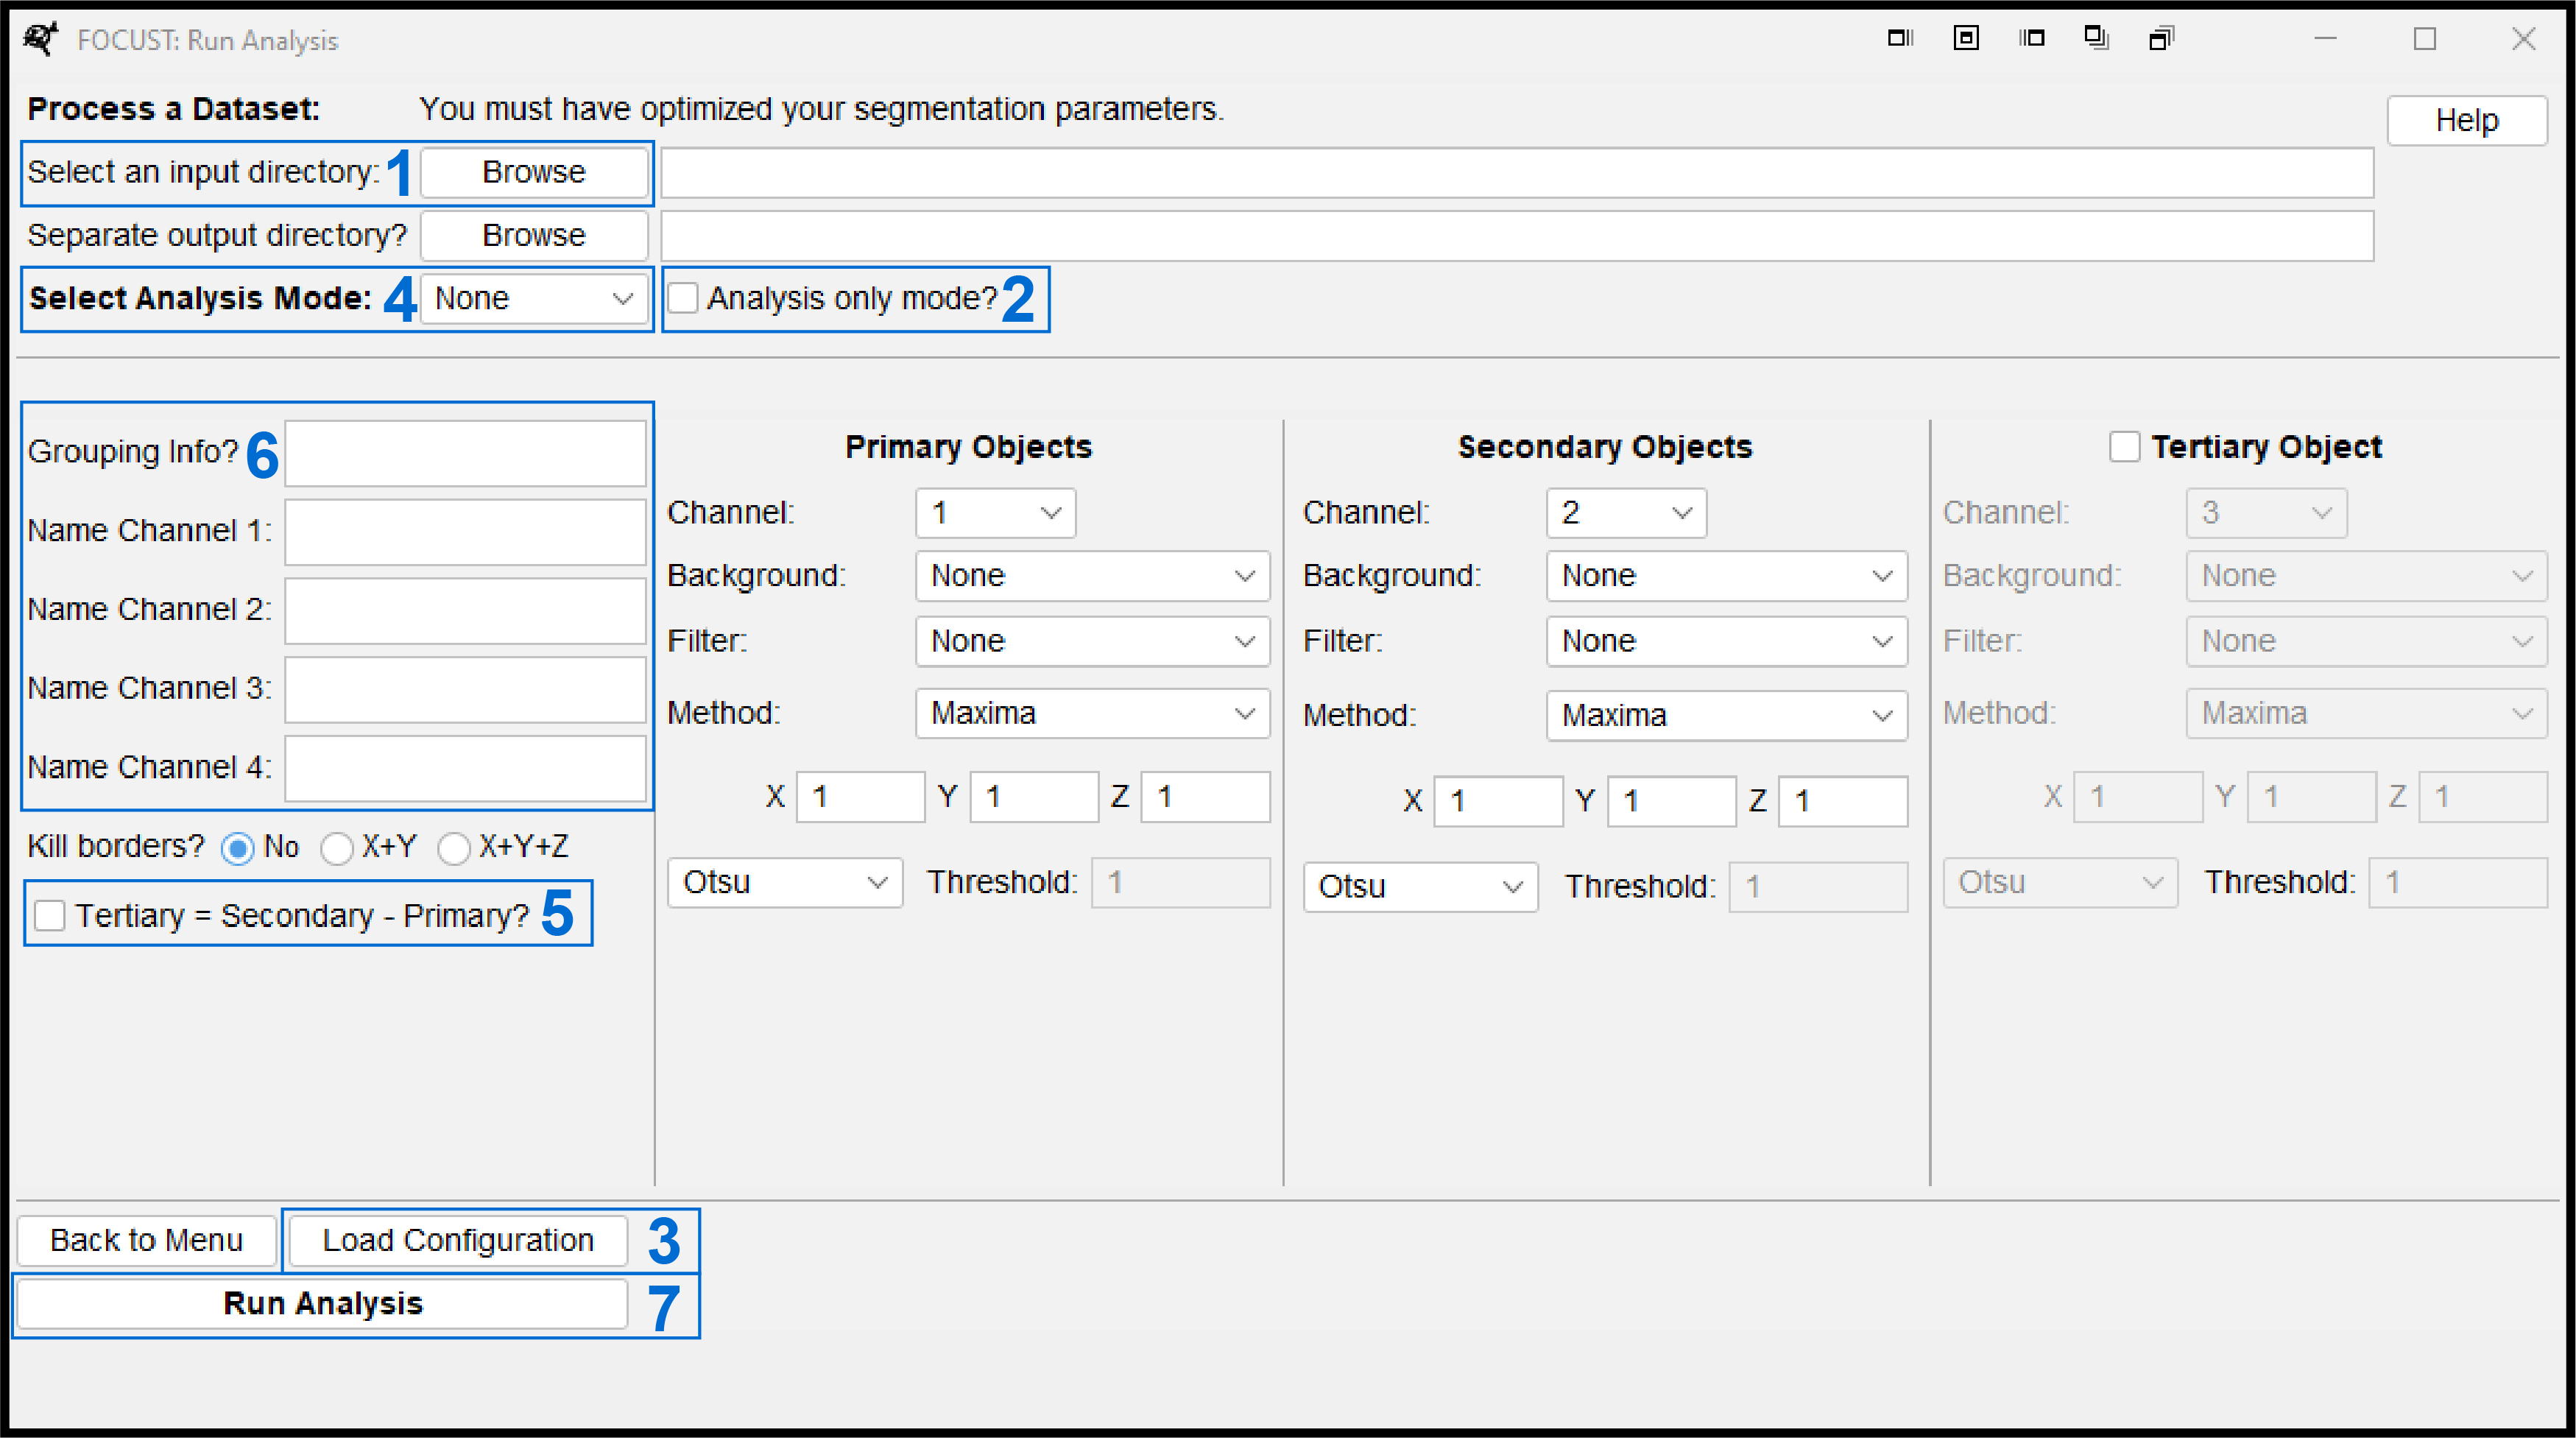
Select the directory that contains the images to process. A separate output directory can be chosen. If no output directory is specified, all outputs will be saved to the input directory.
Toggle Analysis only mode on or off. See Section 5.7.9.
Load a FOCUST-optimization-file or FOCUST-parameter-file to populate the segmentation configurations and streamline your experimental setup.
Select the desired analysis mode. See Section 5.7.4.
Generate a tertiary object by subtracting the primary object from the secondary object. This is useful in generating a cytoplasm by subtracting nuclei from cells or a whole spheroid depending on the sample type.
Add additional text inputs for the results table:
Grouping Info? -> This input will appear as a new column written to every row of the final results tables. Use Grouping Info to add experimental variables that could be used as factors in analysis such as drug treatment, environmental condition, cell type or controls. Leaving this input blank will not create a “Group” column.
Adding names to each of the channels will write these values to each column header when that channel intensity is quantified. Leaving these inputs blank will default to C1, C2, C3 and C4.
“Run Analysis” will commence the configured analysis batch and write a FOCUST-parameter-file to the output directory, providing a record of the analysis conducted for publication or future repeats.
5.7.1.2 Additional Processing
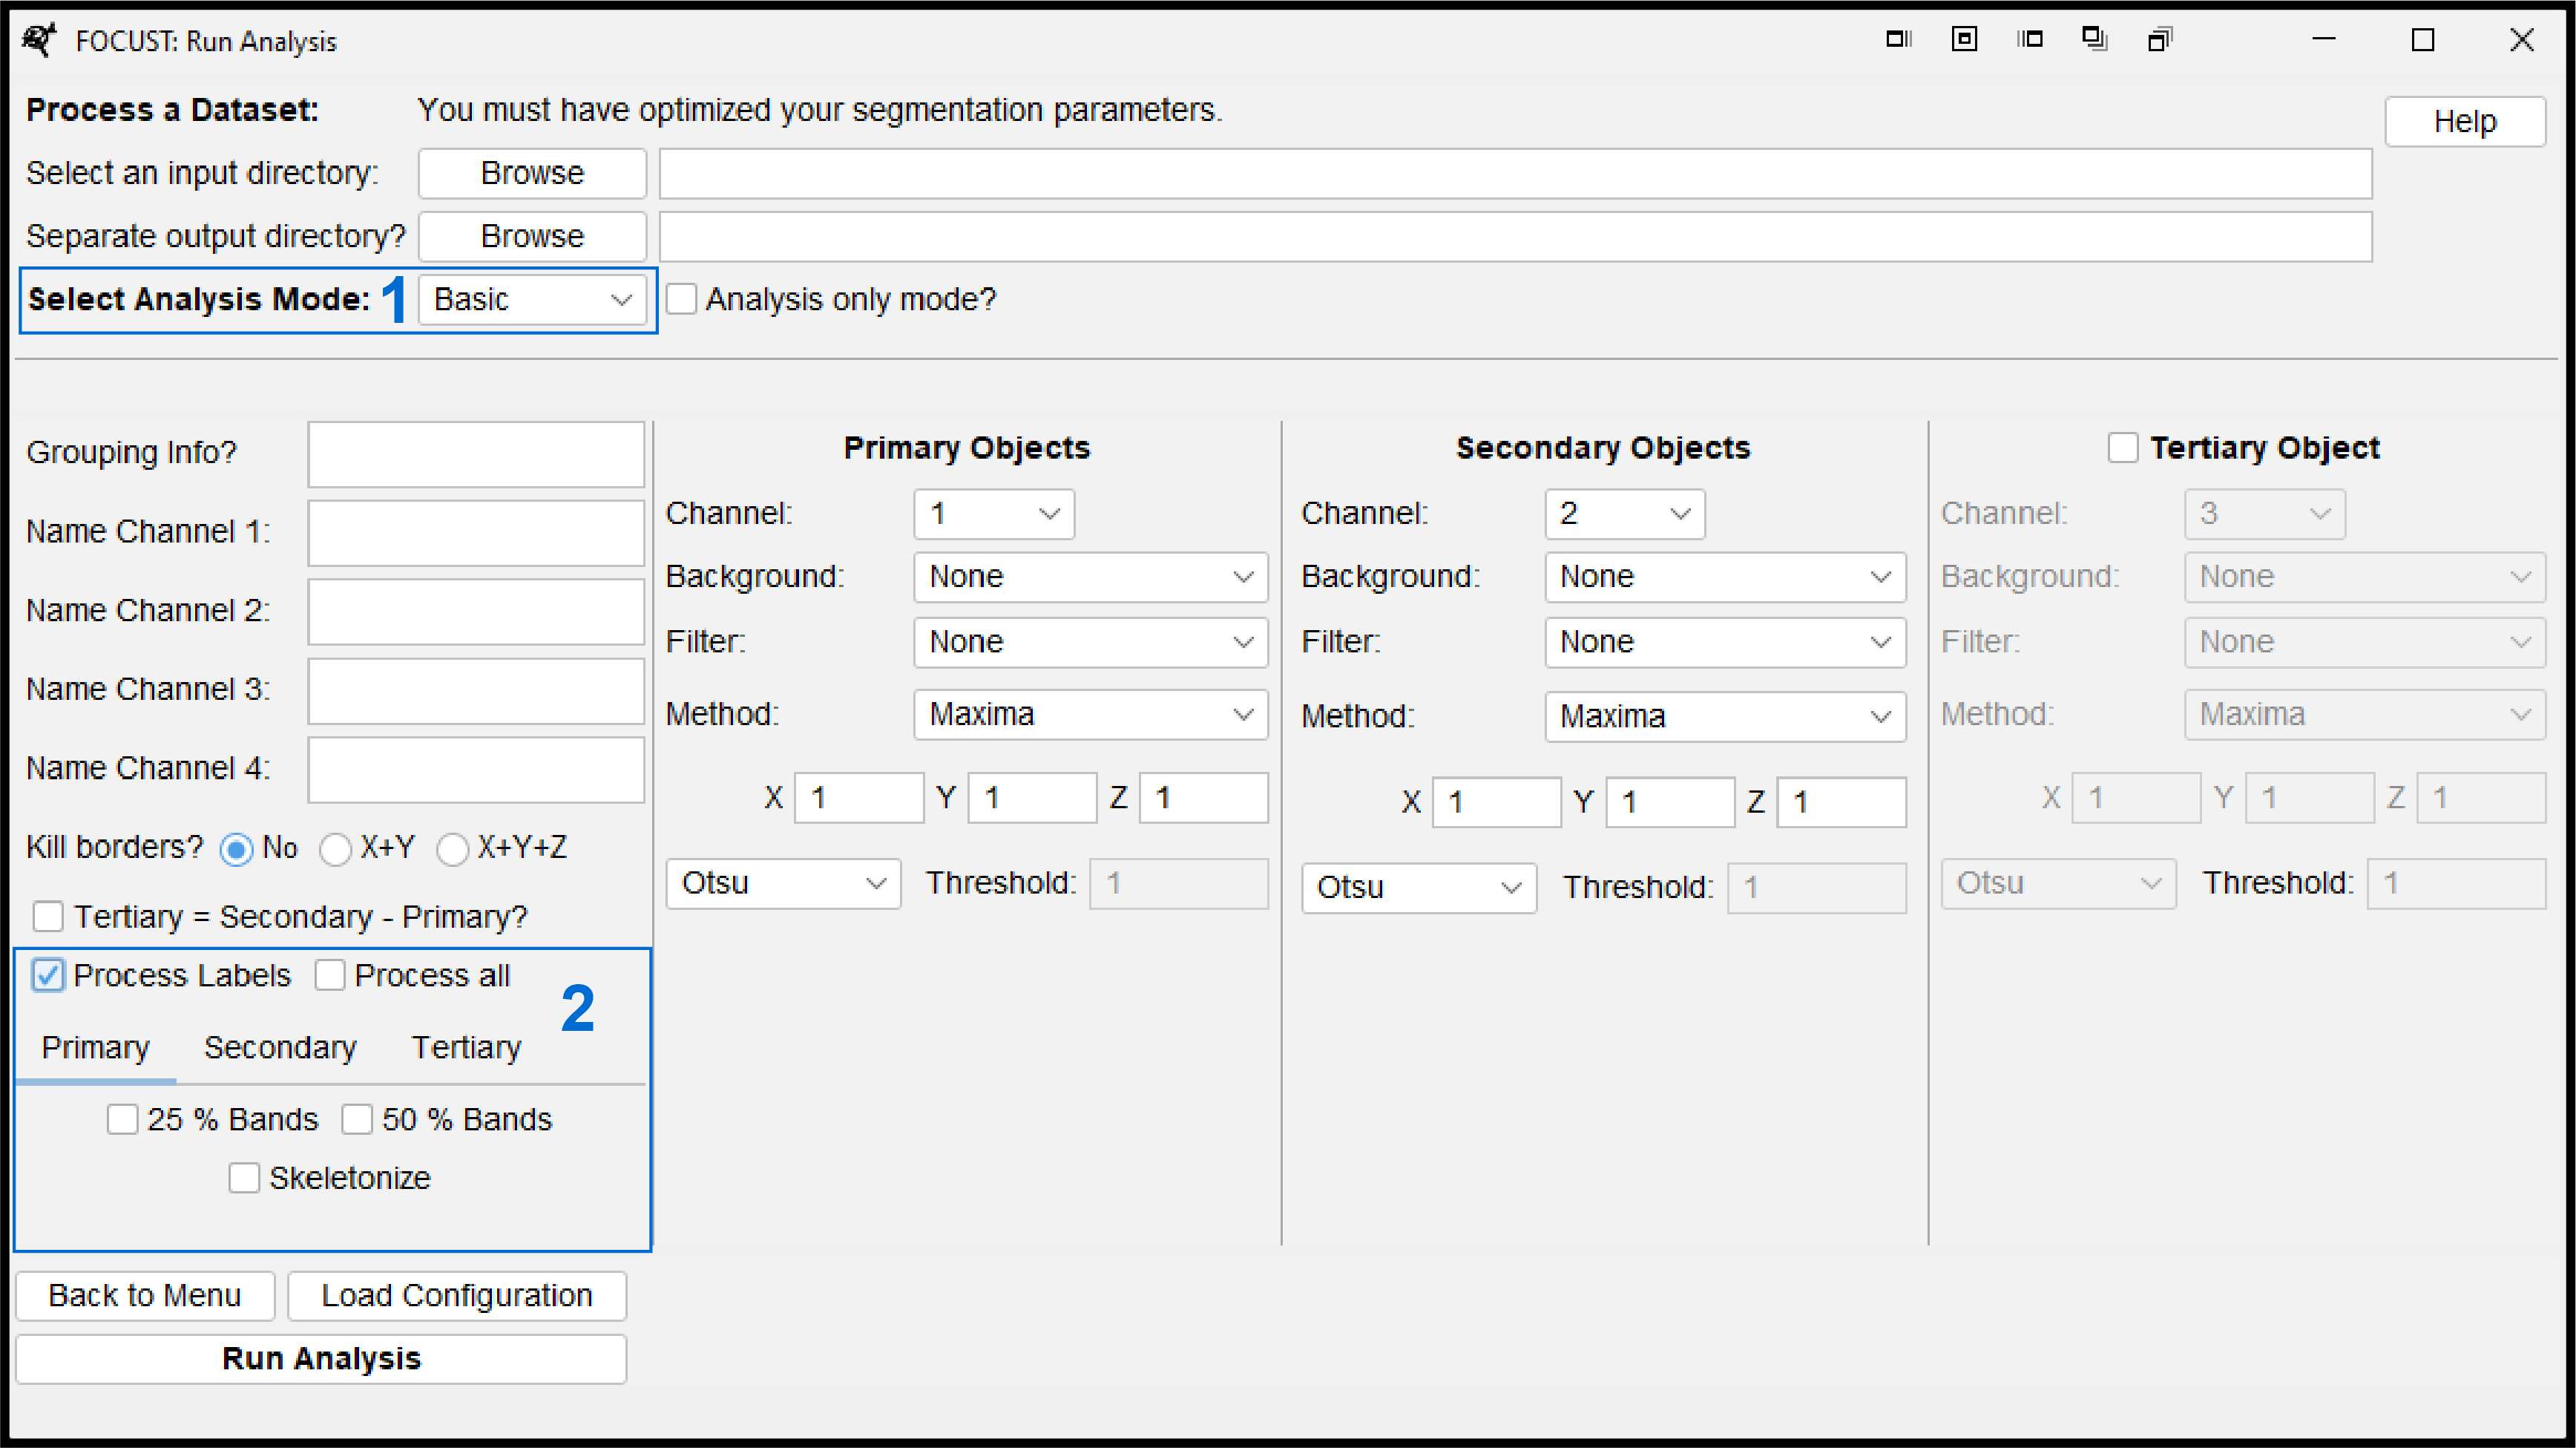
- Selecting an analysis mode other than “None” will unlock additional label processing options.
- Tick “Process Labels” to open the menu.
- Toggle between the different object types and select any desired additional processing.
- If you would like to quickly render all options on or off, use the “Process all” check box.
Hollow labels (such as a cytoplasm) do not stratify or skeletonize well and may produce errors.
5.7.2 FOCUST Parameter and Optimization File
This is a .json file that contains all of the parameters and analysis options that were executed during an analysis run. This file can be opened with any text editor (including notepad). Just like the FOCUST-optimization-file, a parameter file can be loaded into FOCUST to re-run the same analysis on a different data set by clicking the “Load Configuration” button in the analysis GUI. Moreover, this file can be shared with collaborators or published to improve the transparency and reproducibility of your analysis.
5.7.3 Results Files
When batch processing images, managing all of the generated data presents another key hurdle. FOCUST builds and manages results tables so you don’t have to. Results are saved and/or appended so you end up with a single .csv file for a given object type or analysis run across all processed images, rather than one file per image. This means less manual data manipulation, fast tracking statistical analyses and plotting. To help stack results of the same type when executing multiple batches of analysis see Section 5.8.2.
A legend of results column headers is provided below to aid in data interpretation:
5.7.4 Analysis Modes
FOCUST object types reflect the biological context of the sample. Selecting one of the following analysis modes will assert these relationships and manage the data accordingly. The following analysis modes are currently available:
None
| Object type key: | Primary: Primary Secondary: Secondary Tertiary (optional): Tertiary |
| Object relationships: | None. All objects treated independently. |
| Mode-specific analysis: | Segmented outputs saved. No analysis conducted. |
Basic
| Object type key: | Primary: Primary Secondary: Secondary Tertiary (optional): Tertiary |
| Object relationships: | None. All objects are treated independently. |
| Mode-specific analysis: | All segmented objects are measured, and all available channels are quantified within each object. |
Spheroid
| Object type key: | Primary: Nuclei Secondary: Spheroid(s) Tertiary (optional): Cytoplasm (by subtraction) |
| Object relationships: | Each nucleus is related to its parent spheroid. |
| Mode-specific analysis: | In addition to Basic:
Stratification (optional):
|
Single Cell
| Object type key: | Primary: Nuclei Secondary: Whole cell Tertiary (optional): Cytoplasm (by subtraction or segmentation) |
| Object relationships: | Each nucleus is related to its parent cell and cytoplasm (optional). |
| Mode-specific analysis: | In addition to Basic:
|
Speckle
| Object type key: | Primary: Nuclei Secondary: Speckle type 1 Tertiary (optional): Speckle type 2 |
| Object relationships: | Each speckle is related to it’s parent nucleus. |
| Mode-specific analysis: | In addition to Basic:
Stratification (optional):
|
5.7.5 3D Overlap (Colocalization)
While speckle colocalization can be determined by label-restricted intensity measures, it may be useful to know how spatially similar two different speckle targets are in 3D space. When running the Speckle analysis mode, if a tertiary speckle object is present secondary and tertiary objects are isolated by their parent nucleus before colocalization assessment to give data on a per-nucleus level. The overlap between secondary and tertiary speckle objects is determined by the Jaccard index and the Sorensen-Dice coefficient. In both cases, 0 suggests no overlap while 1 indicates perfect overlap. These values are written to the primary object (nuclei) results table as OverlapJaccard and OverlapSorensen, respectively.
5.7.6 Managing Multi-nucleated Cells
There are some instances where multiple primary objects (nuclei) may be found within a single secondary object (cell). This may represent one of two things:
An experimentally relevant phenotype that a researcher wants to know about.
An example of over-segmentation.
In either case, it is important to track instances of duplicate primary object matches and make them known in the final data set. In FOCUST we have implemented a number of methods to adjust the final results table and the labelled primary object images to support the identification of duplicate primary objects.
5.7.7 Results Tables
If duplicate primary objects are identified in the single cell mode, they are flagged in the final results table with an index for the number of duplicate objects. i.e., If cell number 4 is matched with two nuclei, they will be labelled as 4 and 4.1, respectively. These nuclei will contain duplicate cell and cytoplasmic data as is exemplified below.
Explore the sample data sheet below generated in FOCUST running single cell mode. Note that Label 4.1 is a flag for a second nucleus in cell 4. If you trace the rows for Labels 4 and 4.1, you will observe that the secondary and tertiary data are duplicated. You can paste 4 ... 4.5 into the filter box beneath the “Label” column header to isolate this example.
5.7.8 Relabeled Images
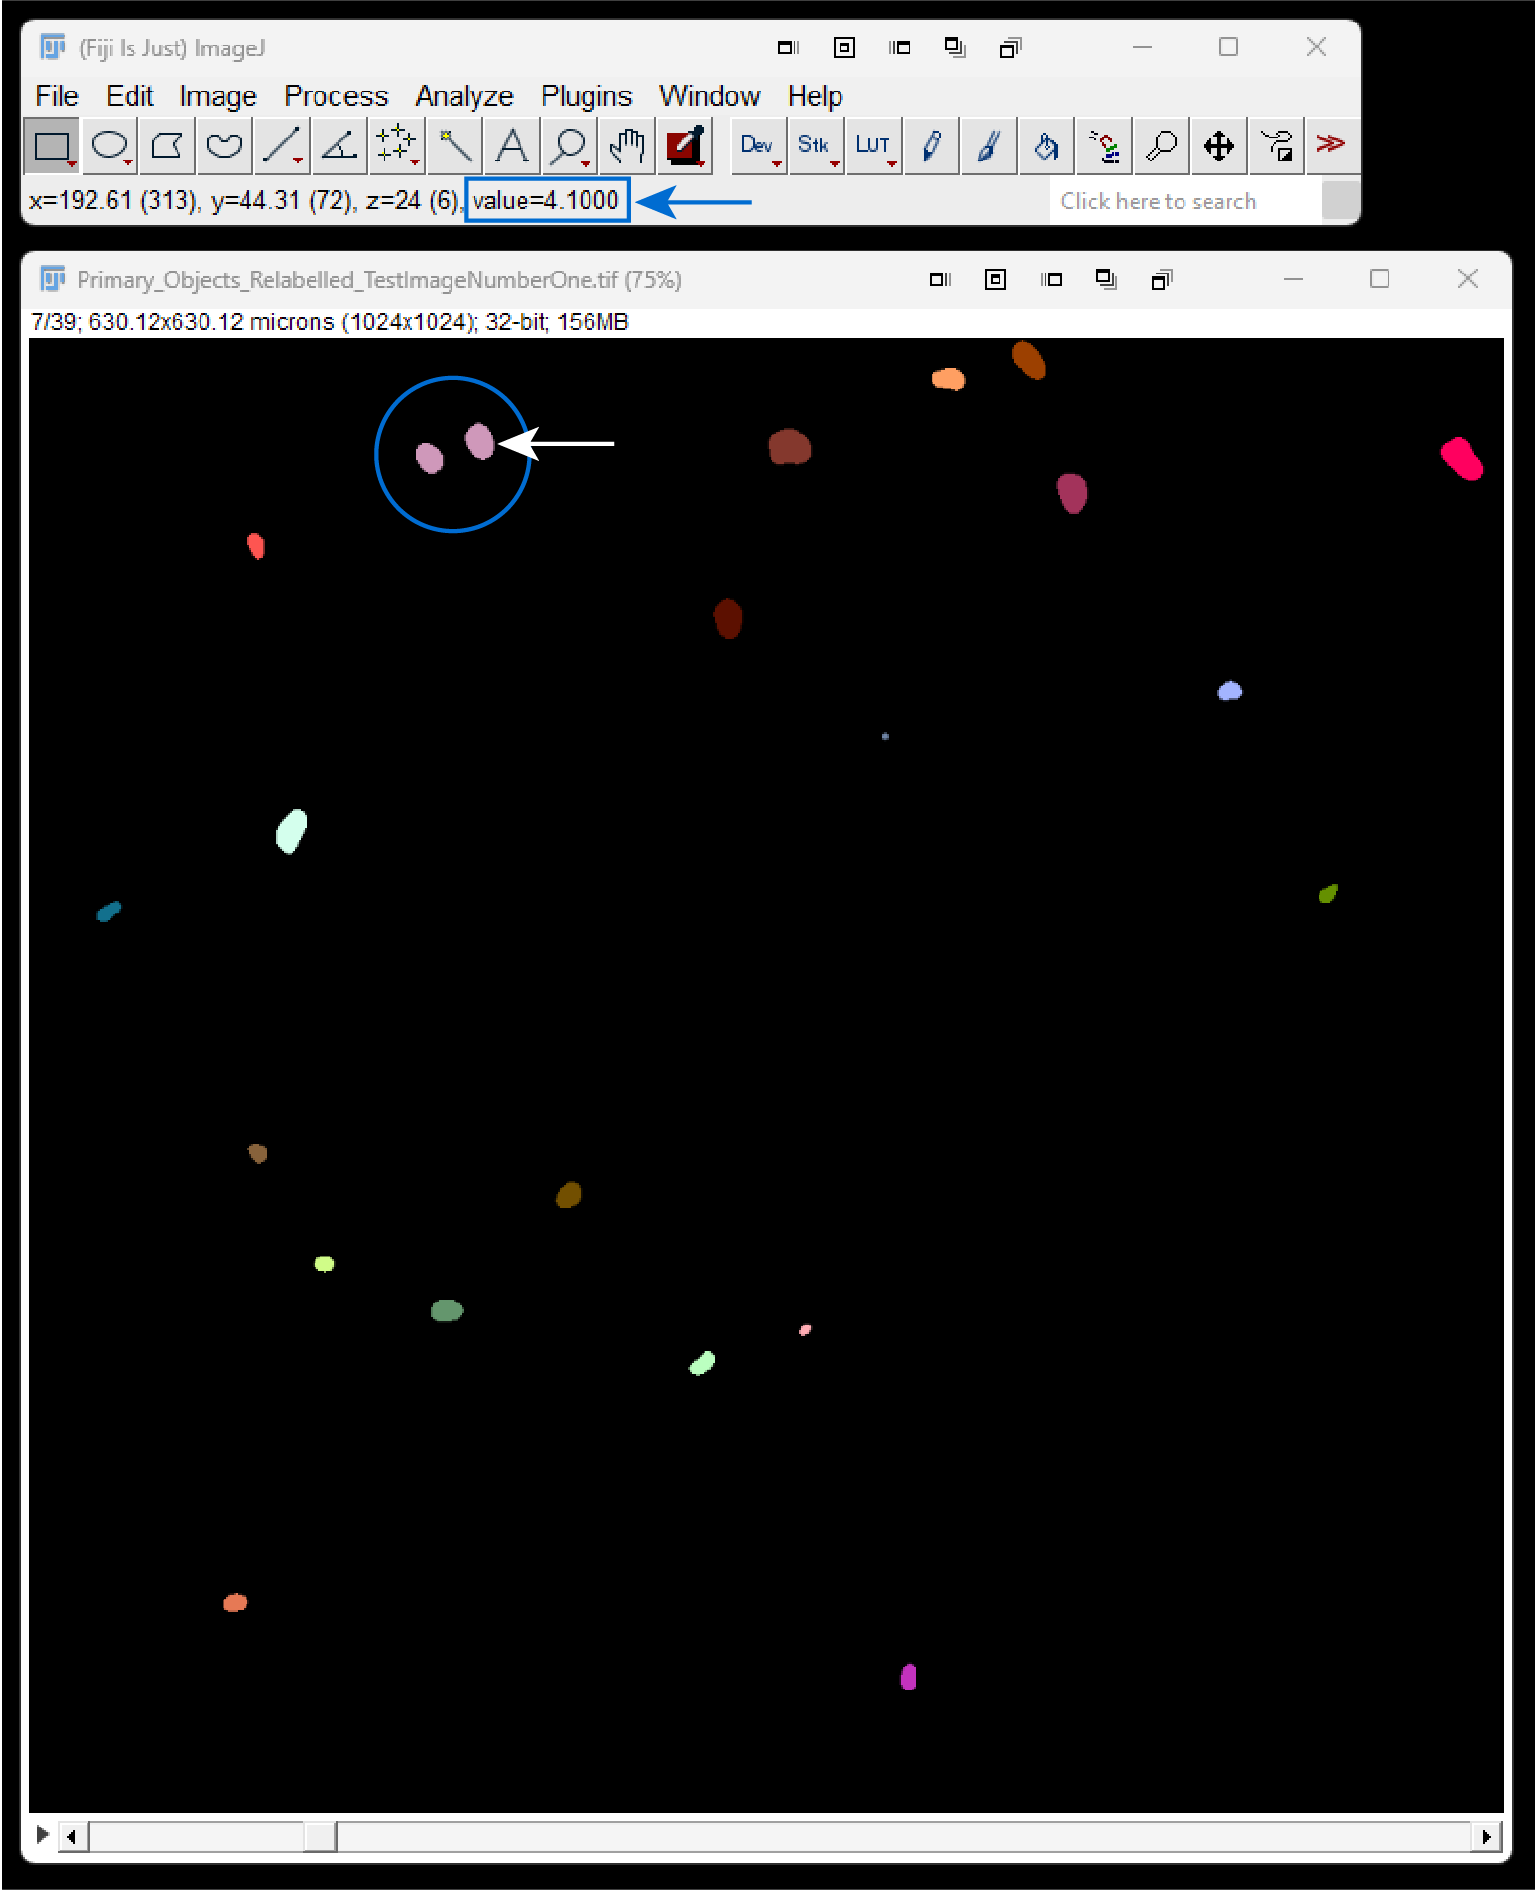
Running single cell mode will also generate a “Primary_Objects_Relabeled_[img-name].tif” image that will be saved to the output directory. This image will contain adjusted label values that reflect the same index-based naming convention described above. This relabeled image is for visualization and transparency purposes only and cannot be used for quantitative analysis in ImageJ. Relabeled objects (i.e., 4.0 and 4.1) will be treated as one object (label 4) by most ImageJ plugins. You can see a label’s value by looking at the ImageJ toolbar and hovering the cursor over the label of interest, as demonstrated below.
5.7.9 Analysis Only
5.7.9.1 Already have segmented data?
If you already have a segmentation workflow that works for you or perhaps use a trained model to segment your data, that’s awesome, FOCUST can still help! FOCUST’s Analysis Only mode will read your original image data and match it to your segmented data by an object-based naming convention. You can select an analysis mode or additional label processing to perform and FOCUST will work through your pre-segmented images.
5.7.9.2 Requirements
You need to have the original image files that were used to generate your segmented data (so that channel intensity can be quantified) and the segmented data itself. To ensure FOCUST can find and read your image data, segmented data must be prefixed with the object type tag followed by the original image name.
For example, here we have an original image called “STIFF_AST_Ki67_YAP_001.nd2”. This is the original multichannel .nd2 file that will be used for channel intensity quantification. We segmented channel 1 into primary objects and channel 4 into secondary objects. The segmented images are labelled as “Primary_Objects_STIFF_AST_Ki67_YAP_001.tif” and “Secondary_Objects_STIFF_AST_Ki67_YAP_001.tif”, respectively. This will allow FOCUST to match the segmented data to the original image and quantify channel intensities for each object type.

If you are unable to generate your segmented outputs with this naming convention and you intend to use FOCUST, we recommend you store your segmented outputs in separate folders for each object type, i.e. save all of your primary objects to a folder and all of your secondary objects to different folder. They must have the name of the original image they were derived from that you would like to quantify. You can then use the FOCUST: Rename Files plugin (see Section 5.8.1) to append the appropriate prefix to each file type.
5.8 FOCUST Utility Plugins
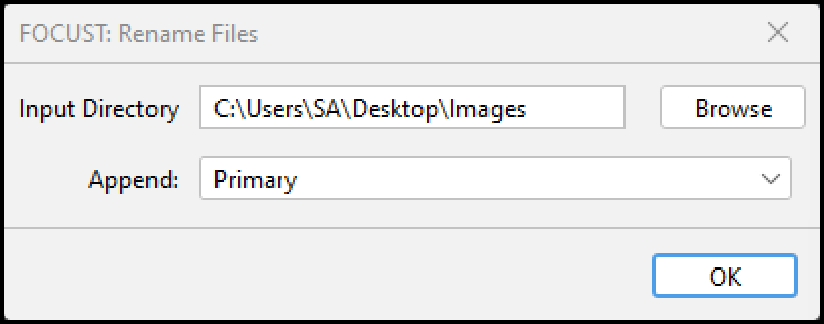
5.8.1 FOCUST: Rename Files
This plugin appends an object type prefix to all files in a given directory. This is useful if you have pre-segmented data that you would like to analyze with FOCUST and need to rename many images.
Executing “FOCUST: Rename Files” will change the file names of every file in the directory you select. Ensure that directory only contains images you wish to prefix with either: “Primary_Objects_”, “Secondary_Objects_” or “Tertiary_Objects_”.
5.8.2 FOCUST: Stack Results
When batch processing images, it can be convenient to run batches based on the experimental group. We encourage you to do this by supporting the addition of a custom “Group” column. However, running a batch for each group will generate n number of repeated csv files.
For example, if I have 3 experimental groups (vector control, drug dose 1 and drug dose 2) and I run three separate analysis batches in Single Cell mode using appropriate Group variable names (VC, DD1 and DD2, respectively), I will end up with 3 “single_cell_results.csv” files. I could manually combine them to perform my analysis, but manually handling data is never a good idea, nor does it scale well if I have 50 groups instead of 3.
To easily combine these .csv files for analysis, use FOCUST: Stack Results. Point this plugin to a directory that can contain sub-directories and it will search for and combine .csv files produced by FOCUST that share the same name. The combined .csv files will be saved in the first directory that you pointed the plugin to. Only .csv files named: primary_objects.csv, secondary_objects.csv, tertiary_objects.csv or single_cell.csv will be combined on a named basis.
5.8.3 FOCUST: Analysis Lite
What about running FOCUST headless or in a macro?
FOCUST’s optimize and analyze graphical user interfaces are not ImageJ macro record-able, nor can they be run headless in a non-interactive fashion. This may be a requirement if a user wishes to run FOCUST on a high-performance computing resource, automate multiple runs of their analysis, integrate FOCUST into existing workflows, or if they simply enjoy using a terminal!
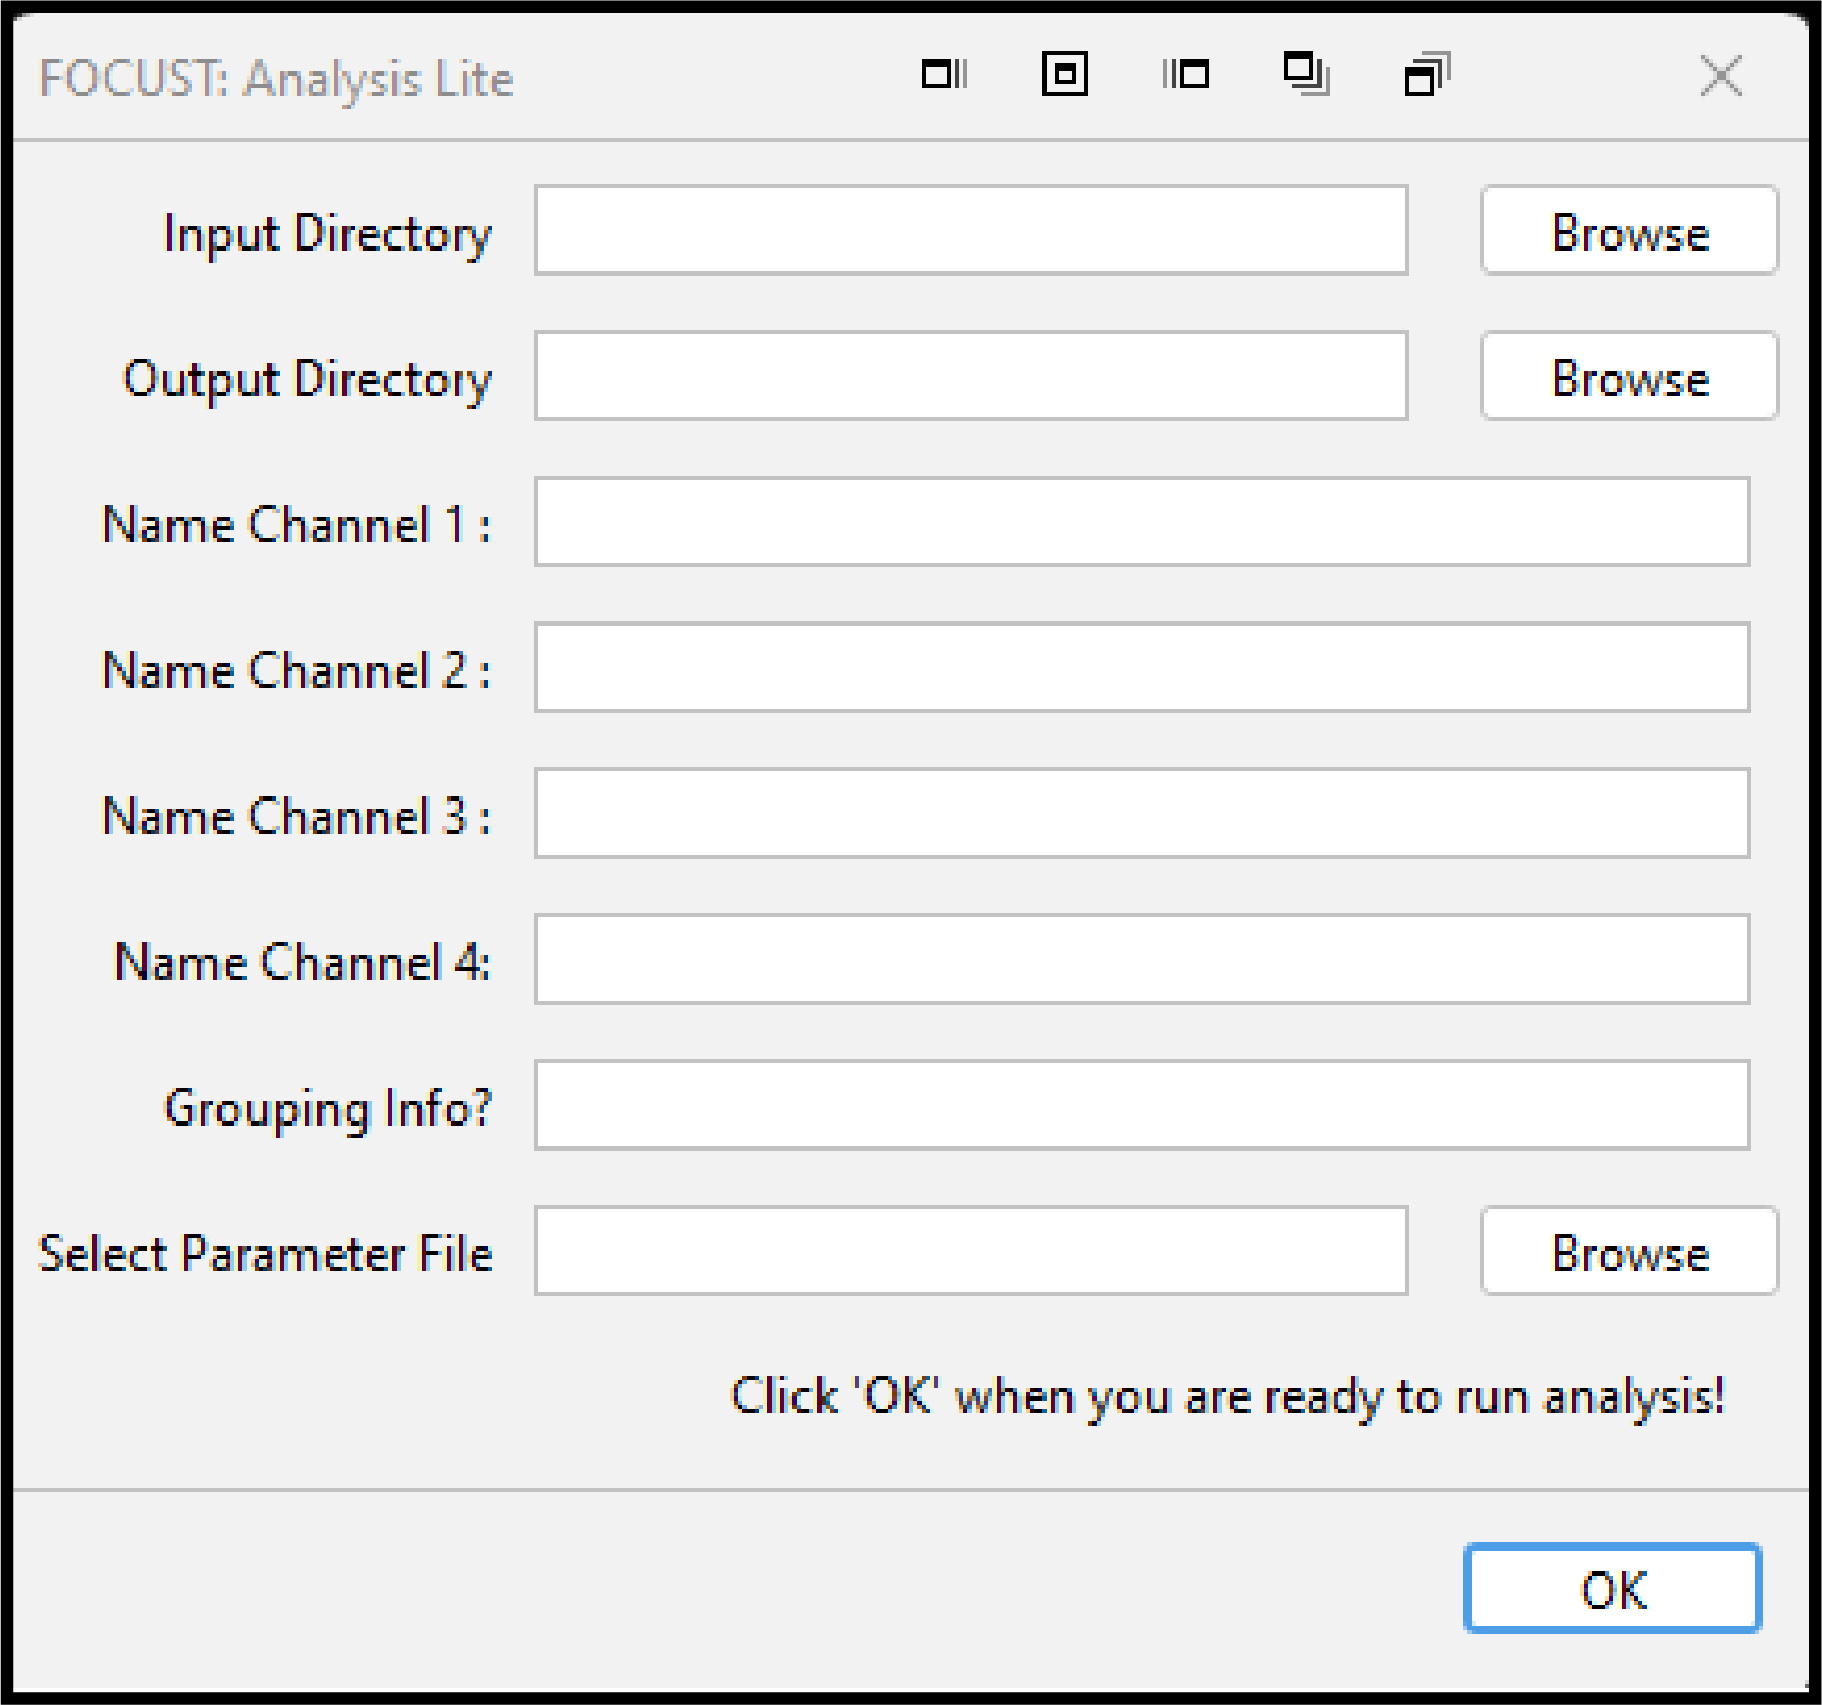
FOCUST: Analysis Lite is an additional plugin within the FOCUST suite that uses a parameterized user interface as many other ImageJ plugins do. This user interface is macro record-able, macro runnable and can be run headless.
5.8.3.1 Requirements
To use FOCUST: Analysis Lite, a user must have a focust-parameter-file that can be generated by running a mock analysis run with the desired configuration. Advanced users may choose to edit or create their own focust-parameter-file, once they are familiar with the structure. Any entries into the plugin dialog will take priority over the contents of the focust-parameter-file.
Example: The selected parameter file contains channel names, a grouping variable and directory information. In the plugin dialog, the user selects a different input/output directory and adds new channel and grouping names. The directories and names added to the plugin dialog will be used instead of the values in the parameter file.
Example: The grouping and channel name plugin inputs are left blank. No grouping variable will be added to any results table, and channel names will adopt the default C1, C2… instead of any names specified within the parameter file.
5.8.3.2 Usage
There are existing issues with the ImageJ macro recorder that may prevent the parameter inputs from being recorded. In this case, use the below macro template and substitute your own parameters as required:
run("Analysis Lite", "inputdir=[path-to-directory] outputdir=[path-to-directory] c1name=1 c2name=2 c3name=3 c4name=4 group=group parameterfile=[path-to-parameter-file.json]");To run FOCUST headless, we recommend you configure and save a focust-parameter-file and a macro as above. From your ImageJ directory, you can run the following command by opening a terminal:
./ImageJ-win64.exe --headless -macro path-to-macro.ijm

# a complete example (including the path to the ImageJ macro):
./ImageJ-win64.exe --headless -macro C:\\Users\\sebastianamos\\Fiji.app\\macros\\runFocustMacro.ijm
Once FOCUST finishing running headless, it will attempt to save the ImageJ log to the output directory. It will be unsuccessful in doing so as the window does not exist. This error is harmless and can be ignored. Note, all log outputs will print to the terminal window regardless of the –console flag.
For information about running ImageJ headless on your particular system here.
5.9 Supported Image Formats
FOCUST can read most common image formats thanks to Bio-Formats.
5.10 Image Operation Details
FOCUST’s image operations are applied in the following order: Background > Filter > threshold > Segmentation Method.
If you select “None” for a background filter, filter or threshold, no operation will be applied.
5.10.1 Background
Background filters are applied before foreground filters (Filters).
None: no filter will be applied.
Difference of Gaussian (DoG): Subtracts two sets of Gaussian blurs from each other. FOCUST will open two input boxes and you must provide a vector (x,y,z) for each blur. The first blur should be smaller than the second. i.e. 2,2,2 and 10, 10, 10.
Gaussian Blur
Top Hat
Bottom Hat
Minimum
Inverted Minimum
Inverted Tubeness
5.10.2 Filters
None
Difference of Gaussian (DoG)
Gaussian
Median
Mean
Tenegrad
Tubeness
5.10.3 Threshold
Thresholds are applied after background and foreground filters.
Otsu
Yen
Huang
Isodata
Intermodes
Li
Triangle
Shanbhag
Min Error
Min
Mean
Max Entropy (Max Ent.)
Moments
Percentile
Renyi Entropy (Renyi Ent.)
Greater Constant (G. Const.)
- Manually define a threshold value. Only pixel values greater than this value will be kept.
Smaller Constant (S. Const.)
- Manually define a threshold value. Only pixel values smaller than this value will be kept.
5.10.4 Segmenation Methods
Maxima (Marker-Controlled Watershed)
- Size of each object: X, Y, Z
Classic Watershed
- Size of each object: X, Y, Z
Voronoi-Otsu Labeling (Voronoi Otsu)
X = Spot sigma: How close detected objects can be. Lower is closer.
Y = Outline sigma: How precise the outline of segmented objects will be. Lower is more precise.
Z = Nothing. Leave as default.
Connected Components Labeling (Conn. Comp.)
- Connected pixels are given the same label. Leave X, Y, Z as default.
Morphogical Watershed - Border (Morpho. Border)
Selected channel has highlighted object boundaries. i.e. cell membrane.
- X = Tolerance: Search of regional minima. Smaller values produce more segmented objects. For 8-bit images start ~ 10. 16-bit ~2000.
- Y = Connectivity: 6 or 26. 6 will give more rounded objects.
- Z = Nothing. Leave as default.
Morphological Watershed - Object (Morpho. Object)
Selected channel has highlighted objects i.e. nuclei.
- X = Tolerance. Search for regional minima. Smaller values produce more segmented objects. For 8-bit images start ~ 10. 16-bit ~2000.
- Y = Connectivity. 6 or 26. 6 will give more rounded objects.
- Z = Gradient radius: Start small.

